

White paper · Diagnose · 21 min read
Sources: Staples, Fletcher Insulation and King Living case studies published on pricinginsight.com; the Staples discounting figures are from the Pricing Periodic Table, CXO Edition, which reports them with the published result. All three are realised results as reported by Pricing Insight, not independently audited, and none is a benchmark for another business.
In this white paper, we present each of these levers and show you how to use them, to drive margin and earnings growth for your business.
The question this paper answers
How can a manufacturer recover margin lost between list price and invoice, and which of the eleven levers should it check first?
Key takeaways
- List prices, discounts, rebates, surcharges and levies can all affect gross margin and earnings.
- Customer-driven costs and input costs create margin risks that pricing mechanisms and contract structures need to address.
- Share of wallet, new customer acquisition, markets, channels and product mix are opportunities to improve margins.
- The paper recommends reviewing customer and product margins, tactical discounts and price increases, and making margin management a company-wide responsibility.
Five Pricing Insight clients show what the levers are worth when they are worked. Staples, a foodservice packaging supplier, Stramit, King Living and Fletcher Insulation each appear below in the same six parts: problem, challenge, what Pricing Insight did, outcome and its status, benefit, and the Pricing Periodic Table elements built.
01Gross margin shows how much freedom a business has to price above cost
Gross Margin management is a critical driver of profitability for any business model. Warren Buffett believes that firms with excellent long-term economics tend to have consistently higher margins.
Durable competitive advantage creates a high Gross Margin percentage because of the freedom to price in excess of cost. Companies can be categorised by their Gross Margin percentage:

Greater than 51% = Outstanding business model
Greater than 40% = Durable competitive advantage.
Less than 40% = Margins eroding due to competition.
Less than 20% = no sustainable competitive advantage
Below is a checklist that can help you identify 11 margin levers to improve profitability.

The bands are a rule of thumb, not a law. Gross margin depends on the industry, the cost of goods definition a company uses and how much of its cost sits below the gross margin line, so the useful comparison is with peers and with the business’s own history.
02Six price levers decide how much of the list price reaches the invoice
List price: is your list price structured correctly? Do you have the right price relativities across products?
Customer discount level: Are your customers buying at the right pricing levels? If you have a simple volume vs price discount matrix to set customer pricing, you are probably leaving money on the table.
Quantity price breaks: are your price breaks for various order sizes optimised? In many cases, quantity breaks are straight line linear pricing arrangements. This leaves money on the table.
Tactical discounts: do you have control of the tactical discounting for the business? Many sales reps are given levels or are delegated pricing authority far in excess of what is commercially sustainable. If your EBIT margins are 5% and you allow your sales teams the discretion to offer additional tactical discounts of 5%, you have theoretically put 100% of your EBIT margin at risk. If pricing was a card game, you are holding a losing hand.
Staples
Office supplies distributor · A$6.8m EBITDA within 12 months · Realised
| Client and problem | Staples grew revenue by 5 per cent while profit fell 3 per cent. Its reps were discounting 5 to 15 per cent on a 6 per cent EBIT margin, the position the tactical-discounts lever describes, where seller discretion can put the whole EBIT margin at risk. |
| Challenge | The discounting sat inside individual deals across thousands of items, and growing revenue hid it in the headline numbers. |
| What Pricing Insight did | An SKU-level diagnostic and quick wins, then algorithmic price optimisation through Project Blackbird on 5,000 items, setting prices by customer and product from the business’s own transactions. |
| Outcome | A$6.8 million of EBITDA within 12 months on A$80 million of addressable revenue; a realised result as published. |
| Benefit to the client | Earnings growth from revenue the business already had, with set prices in place of discretionary discounts on a thin EBIT margin. |
| Periodic Table elements built | 61 Da Discount authority and controls; 51 Dt Discount structure and tiers; 46 Pm Price modelling; 49 Lp List price alignment. |
Rebate levels & structure: Are your rebates active or passive? If you don’t know what this question means, and you have rebates in your business, then they are most likely passive. In other words, they serve no purpose other than to transfer money from your company bank account to your customers like a dead weight tax.
Rebates are a crucial price and value exchange mechanism, but are poorly understood, managed and optimised, especially in the building materials industry. Take a detailed and informed look at rebates. Don’t listen to anyone who tells you to get rid of rebates entirely; done well, they can be a master stroke, but mostly they are done badly.
A passive rebate is often invisible in the reports sellers use, because it is paid after the sale. One account at a foodservice packaging supplier shows the size of the gap between the invoice view and the net view.
| Measure, national contract caterer account | Value |
|---|---|
| Invoice margin by site, as the sales report showed it | 53 to 56 per cent |
| Rebate paid back after the sale | 26 to 30 per cent of purchases |
| Margin by site once the rebate is counted | 32 to 37 per cent |
Exhibit 1. The invoice view and the net view of the same sites. Only the first was in the reports sales staff used. Source: Pricing Periodic Table, CXO Edition, Figure 3.1.
Foodservice packaging supplier
Foodservice packaging, private equity backed · A$2m EBIT from quick wins · Realised
| Client and problem | A foodservice packaging supplier backed by Five V Capital sold to a national contract caterer whose site invoices showed margins of 53 to 56 per cent. A rebate of 26 to 30 per cent of purchases, paid after the sale, cut the same sites to 32 to 37 per cent, and the sales reports did not carry the second figure. |
| Challenge | A pricing model put the caterer’s invoice prices about 11 per cent above a modelled fair value, which on its own pointed to a price cut. Because the rebate sat behind those prices, a cut to the invoice would have handed the customer a second discount on top of the first. |
| What Pricing Insight did | A pricing diagnostic and quick wins, a national price list architecture and a customised discount matrix, a mandated pricing team, key account management tools, AI value selling and Pricing University. For the caterer, the recommendation put the rebate and its terms first in the next negotiation and invoice price second. |
| Outcome | A$2 million of EBIT realised from quick wins, with a further A$6 million to A$9 million of margin opportunities identified. The caterer account carries a projected pricing opportunity of about A$180,000 a year. |
| Benefit to the client | Rebates and discounts are now judged on net price, which removes the risk of cutting an invoice price that was already low once the rebate was counted. |
| Periodic Table elements built | 16 Rb Rebate and incentive design; 55 Tn True net price program; 51 Dt Discount structure and tiers; 49 Lp List price alignment. |
Surcharges and levies: Customers often want bespoke products or service, but this means death to profitability when you run a business at scale. Customers are almost always price insensitive to surcharges and levies. Think about the next time you book an airline ticket: Surcharges and levies can make up to 50% of the ticket price.
Most companies don’t utilise their ERP systems effectively to capture substantial revenues and margins with appropriately structured (and rules-bound) surcharges and levies. Make a call today to your IT and systems team to find out what surcharges and levies capability your invoicing system can handle. If you transport anything as part of your value proposition, surcharges and levies should be a mandatory component of your pricing architecture.
03Customer-driven costs and input costs each need a pricing mechanism
Costs may play no real role in setting prices, but they are crucial to managing margins and earnings. This distinction is subtle, but crucial to understand. There are two main types of costs:
- Costs that are incurred as a result of customer demand: for example, increased frequency of delivery will drive up transport costs; increased demand in general will drive up overtime labour costs. Bespoke or customised orders will drive up a whole range of costs. This is why you need to ensure your price architecture addresses these cost risks that are almost 100% the result of customer demand.
- Input costs: Fuel, energy, raw materials, and other similar items all create margin risk exposures that must be addressed through a pricing mechanism of one type or another. Too many companies have margin exposures through ineffective contract structures that leave them carrying all of the input cost risk with limited upside reward. Some companies have escalatory rise and fall clauses, but these are often inconsistent, have measurement periods that don’t reflect the real costs, or are simply not managed well resulting in margin leakage.
Two rules keep the mechanism honest. Put lasting input-cost rises into the price as a permanent change, and keep surcharges for short-lived costs, because overusing surcharges leaves customers feeling overcharged. Charge for the services a customer chooses, such as extra deliveries, small orders and custom work, so that the customers who cause the cost pay for it.
Stramit
Steel building products · A$4m to A$7.5m annual EBIT opportunity · Identified
| Client and problem | Stramit was losing margin through charges, agreements and price files that were not applied consistently. Freight was often not charged or charged inconsistently; a staff member said “A number of invoices don’t get charged at all.” Flat rebates paid from the first dollar of sales gave money away without asking customers to commit or grow. |
| Challenge | Below-cost and anomalous prices loaded at a 2018 system roll-out remained in customer files, special pricing agreements had become the routine way to reach market prices, and sellers could not see the true cost, the steel supplier’s rebates or the customer rebates behind a price. Cost-plus pricing persisted on bought-in items. |
| What Pricing Insight did | A pricing diagnostic across the business, mapping the evidence against the nine domains of the 9PE canvas, which uncovered the margin leakage, aligned sales and leadership on pricing priorities and set out how to rebuild pricing capability. |
| Outcome | An annual EBIT opportunity of A$4 million to A$7.5 million, identified. |
| Benefit to the client | A sized view of where margin left the business, from uncharged freight to legacy rebates and below-cost price files, which reduces exposure to leakage that no single report showed. |
| Periodic Table elements built | 53 Sx Charges for services and extras; 16 Rb Rebate and incentive design; 57 Dq Pricing master data; 56 Bc Buy-price and cost management. |
04Volume adds margin when it comes from the right customers
Share of wallet strategy
How much share of wallet do you have for the top 20% of your customer base that represents 80% of your revenues? Now, how much potential share of wallet is available from the last 20% of your customers? Share of wallet is possibly the most underutilised revenue opportunity in the playbook. Everyone knows what share of wallet means, but more often than not it is seen as a “nice to have”. Go through the sales key category and work out what share of wallet you have, then identify a matrix of high margin customers with low share of wallet vs. low margin customers with high share of wallet. Create a strategy to drive more sales to higher margin customers.
New customers
New customers are much harder to sell to than existing customers; this has been documented endlessly. However, what is your new customer acquisition strategy? Customer pipeline strategy requires a much more sophisticated approach than sales trainers would have you believe.
To make a new sale or acquire a new key account you will most likely need to:
- Create awareness of your services and/or products
- Be top of mind when the customer decides to switch suppliers
- Be positioned as a supplier of choice based on your IP and value, not price and product.
- Influence at least 3 to 5 people who play the role of gatekeeper, influencer and economic buyer for your customer.
- Be able to negotiate on value, not traditional positional negotiation techniques as taught by the sales trainers and negotiation schools. These philosophies are neat and usually involve an acronym to remind a student of the process, but they are ineffective.
05Who you sell to, and what you sell, predicts the margin
Markets and channels
Where and who you sell are crucial factors in the margin optimisation game. Hilti power tools sell direct to avoid the commoditisation that results from selling through a big box retailer. Other companies like Caterpillar have extremely strong dealer networks that have multiple revenues sources (new units, used units, short term rental units, spare parts and service + finance). This takes pressure off CAT to offer new products at low margins, which can often be the case in capital equipment sales. In fact, it is who you sell to that predicts the margin outcome more than any other factor. We live in an age of “market segments of one”. Your pricing opportunity is to identify the value you generate for each individual customer, not each market segment or channel.
Product
It is almost always a self-fulfilling prophecy that what you focus on is what you get. Sales teams often focus on moving high-volume commodity product lines that generate great revenues but little margin. It can be the equivalent of fool’s gold: Whilst the argument that volume contributes to lowering fixed costs is true, there is a corresponding rise in variable costs that often offsets the lowered fixed cost per unit. Driving volume can be a zero-sum game. But there is a far worse penalty for companies with a volume obsession: Because they are focused on looking for big volume opportunities, they miss seeing the three smaller-volume but higher-margin opportunities which, when combined, generate far more free cash flow and margin than the single big opportunity.
The three smaller opportunities require a more sophisticated sales and marketing program. Because this program is not in place, the company defaults to a reality shaped by high volume and low margins.
King Living
Furniture design, manufacture and retail · $4.1m incremental EBITDA · Realised
| Client and problem | King Living sells modular, customisable furniture across configurations, materials, upgrades and services. The premium for moving between two related configurations varied considerably with the fabric or leather chosen, so price relativities across the range did not follow the value of the product. |
| Challenge | Category averages concealed inconsistent price movements between comparable products and uneven premiums for a finish or configuration, and the breadth of choice made one coherent structure hard to hold. |
| What Pricing Insight did | Analysis of sales and realised selling prices across 2020 to 2022 from category down to package and material grade, a price architecture review, and showroom visits and mystery shopping. The recommendations set clearer relationships between related products and deliberate entry, mid-range and premium price points, and a model that separates the transport charge from the set-up and packaging-removal service. |
| Outcome | King Living implemented the advice and generated $4.1 million in incremental EBITDA; a realised result as published. |
| Benefit to the client | Value captured from the relationships between products, upgrades and services rather than from a single percentage increase, with a service charge recovering the cost of delivery and set-up. |
| Periodic Table elements built | 52 Rl Price relativities and volume breaks; 49 Lp List price alignment; 53 Sx Charges for services and extras; 29 Vs Value selling. |
An analysis of building materials companies shows gross margins to have wide variances over a 10-year period. Some of this can be explained through cyclical margin pressures; however, a significant number of companies have undertaken active margin expansion initiatives to extract 200-300 basis points of margin above what otherwise might have been achieved.
Here are the Gross Margin % ranges over the past 10 years for several key building materials companies that we recently looked at in the Australian market.
Exhibit 2. Gross margin percentage ranges for four Australian building materials companies, from public reporting as reviewed by Pricing Insight when this paper was written. These are not Pricing Insight client results.
| Dulux Group Ltd | Top 10% of building materials companies. | Min: 58.64%. | Max: 62.31%. | Current: 59.31% |
| Boral | Top 40% of building materials companies | Min: 26.93 | Max: 33.95 | Current: 31.36 |
| Brickworks | Lowest 50% of building materials companies | Min: 22.72 | Max: 32.49 | Current: 22.72 |
| Fletcher Building | Lowest 20% of building materials companies | Min: 15.64 | Max: 25.54 | Current: 15.64 |
It is almost a certainty that when a manufacturer drops below 20% gross margin, EBIT margins will be close to zero. As a rule, manufacturers should target gross margins of at least 30% to maintain a margin of safety and make the economics of volume and price stack up.
What we know from these building manufacturers is that the high margin results from Dulux and Boral are not an accident or lucky circumstance. These two companies have had a relentless focus on pricing and margin for the past 10 years. They have implemented a number of revenue and margin improvement programs, company-wide.
Fletcher Insulation
Insulation manufacturing · 250 basis points of gross margin, about A$2.25m annualised EBITDA · Realised
| Client and problem | Fletcher Insulation sold through territory managers across all six states and territories, with most customers individually priced and many quotes built job by job in spreadsheets. Insulation is a small share of a builder’s total cost, customers compare square-metre rates, and imported product had widened their choice. |
| Challenge | There was no base list price, most pricing decisions rested with one central analyst, sellers had no pricing tactics guide, and approvals could pass through three or four people. A staff member said: “We don’t have a retail price list, which is really Sales 1.01.” |
| What Pricing Insight did | A pricing capability diagnostic located the gaps in price architecture, discount control and pricing resources and sized an EBIT opportunity of A$2.2 million to A$2.5 million. Staff then completed Pricing University’s Pricing Fundamentals, and the business acted on what they learned. |
| Outcome | A new pricing structure, a price increase and reduced discounting lifted incremental gross margin by 250 basis points, an annualised run-rate of about A$2.25 million to EBITDA; a realised result as recorded from the engagement. The diagnostic figure is an identified opportunity. |
| Benefit to the client | Gross margin, the measure this paper ranks companies on, moved by 250 basis points, inside the 200 to 300 basis point range the paper attributes to active margin expansion. |
| Periodic Table elements built | 49 Lp List price alignment; 61 Da Discount authority and controls; 43 Pi Price increase process; 12 Mi Margin improvement program; 28 Cc Commercial capability and training. |
06A margin expansion plan works the eleven levers with the whole business
Work through these 11 margin levers with your team and develop a Margin Expansion Action Plan. Identify your high revenue and high margin customer vs your low revenue and low margin customers. Do the same analysis for your products and/or services. What key trends or themes emerge? Can these learnings be replicated or applied to new customers or prospects?
Can you review your tactical discounts?
Is your next price increase a flat percentage or is it customised for each product / service and by customer? A customised approach will de-risk customer rejection.
Make margin expansion a daily focus for the next 90 days and then review the results.
What else can you do?
Putting one person in charge of pricing alone doesn’t scale across a business. A centralised pricing hub can make a lot of difference, but you need everyone aligned.
Give everyone in sales, marketing and finance + operations an education on how margins work and what they can do to assist with identifying margin opportunities and implementing margin capture strategies. Margin management is a company-wide responsibility.
Three things are safe to read from the five cases. Speed: Staples realised A$6.8 million of EBITDA within 12 months, and the foodservice packaging supplier realised A$2 million of EBIT from quick wins. Size: the realised results run from about A$2.25 million of annualised EBITDA at Fletcher Insulation to $4.1 million at King Living and A$6.8 million at Staples, and the identified opportunity at Stramit is A$4 million to A$7.5 million a year. Risk: in each case the work closed a route by which margin left the business without a decision, whether discounts at a seller’s discretion, rebates invisible in the sales reports, uncharged freight or price relativities that did not follow value. Identified opportunities are not results, and none of these figures is a benchmark for another business.
07The Pricing Periodic Table elements this paper builds
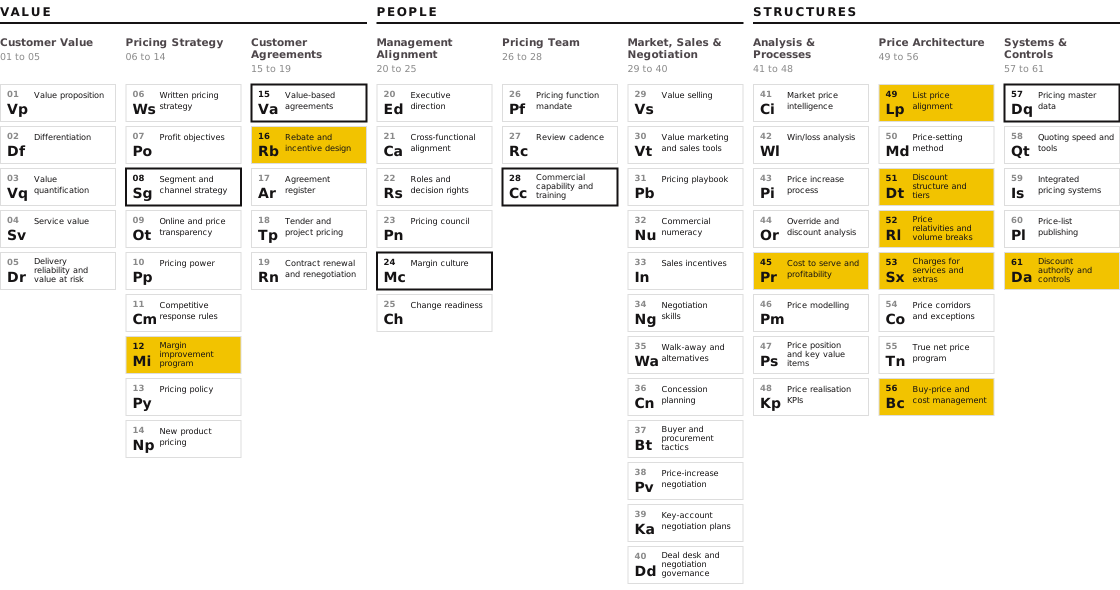
The Pricing Periodic Table sets out 61 elements of pricing capability in nine domains, across Value, People and Structures. Nine are built by the levers in this paper: 49 Lp List price alignment (list price), 52 Rl Price relativities and volume breaks (relativities and quantity breaks), 51 Dt Discount structure and tiers (customer discount levels), 61 Da Discount authority and controls (tactical discounts), 16 Rb Rebate and incentive design (active rebates), 53 Sx Charges for services and extras (surcharges and levies), 45 Pr Cost to serve and profitability (customer-driven costs and the customer and product margin analysis), 56 Bc Buy-price and cost management (input costs) and 12 Mi Margin improvement program (the Margin Expansion Action Plan). Five are depended on: 15 Va Value-based agreements carries rise and fall clauses into contracts, 08 Sg Segment and channel strategy decides where and who you sell to, 57 Dq Pricing master data supplies the costs and charges the invoice reads, 28 Cc Commercial capability and training gives staff the education the paper asks for, and 24 Mc Margin culture makes margin a company-wide responsibility.
The client cases map onto these elements directly. Staples built 61 Da and 51 Dt in place of discretionary discounts, the foodservice packaging supplier built 16 Rb and judged rebates on net price, Stramit’s diagnostic found the gaps in 53 Sx, 16 Rb and 57 Dq, King Living built 52 Rl and 53 Sx, and Fletcher Insulation built 49 Lp and 12 Mi on the capability laid down through 28 Cc.
08Frequently asked questions
How can a manufacturer recover margin lost between list price and invoice?
Trace each step from list price to the net price after rebates: customer discount levels, quantity breaks, tactical discounts, rebates, and surcharges and freight that are not charged. Set discount authority by margin and price customers and products from the business’s own transactions. Staples realised A$6.8 million of EBITDA within 12 months after reps had been discounting 5 to 15 per cent on a 6 per cent EBIT margin.
My margins are shrinking. What should I do about pricing?
First separate price from cost. A foodservice packaging supplier saw gross margin rise by more than A$11 million in one year while unit price rose about 1 per cent and unit cost fell about 8 per cent; without the cost saving, margin would have fallen. Then work the eleven levers by customer and product, and customise the next price increase rather than applying a flat percentage.
How do I measure price leakage in my business?
Compare invoice margin with net margin after rebates, freight, credits and overrides, customer by customer and product by product. At one caterer account, site invoice margins of 53 to 56 per cent fell to 32 to 37 per cent once the rebate was counted. Report both figures to the people who set prices.
Are rebates worth keeping?
Active rebates are, passive ones are not. A rebate earns its cost when it asks for something in return, such as growth, commitment or range, and is reviewed against it. Flat rebates paid from the first dollar of sales, as at Stramit, transfer money to customers without a return.
Should we charge surcharges and freight to B2B customers?
Charge for the services a customer chooses and the costs a customer causes, through rules in the invoicing system. Put lasting cost rises into the price and keep surcharges for short-lived costs. King Living’s recommendations separated the transport charge from the set-up service, and Stramit’s diagnostic found freight often not charged at all.
09How Pricing Insight helps
The paper’s margin levers need clear ownership and controls, particularly for discounts and price decisions. Pricing Capability & Governance sets pricing roles, decision rights, discount approvals, price floors and a Pricing Council, helping make margin management a company-wide responsibility and supporting margin gains that last across the business.
The work runs in three stages, each drawing on evidence from the client’s own transactions. Pricing Insight has completed 160+ engagements, and price optimisation programs return between 5 and 10 times their cost in year 1.
Diagnose
The eleven levers measured from your own invoices through the Strategic EBIT Opportunity & Risk Diagnostic: list to net price by customer and product, discounts and rebates on net price, uncharged freight and services, and input-cost exposure in contracts, sized against a baseline finance accepts.
Optimise
List prices, relativities, quantity breaks and customer discount levels reset, with charges for services written into the invoicing rules. The EBITDA Improvement Program sets target prices by customer and product, with the EBIT effect of each line and ERP-ready files.
Transform
Pricing roles, decision rights and discount authority through Pricing Capability & Governance, a Pricing Council that reviews the margin levers monthly, and sales, marketing and finance staff trained in how margins work.
Which of the eleven levers is costing your business the most margin today?
A first conversation establishes how this applies in your business and whether a diagnostic is warranted. Ron Wood, +61 410 534 099.
Ron Wood is the Founder and Managing Director of Pricing Insight, an Australian pricing strategy consultancy he established in 2007. He has worked in pricing for 30 years, first as a pricing and commercial manager in consumer goods, building materials and capital equipment, and since then across 160+ engagements in Australia, New Zealand, South East Asia, India, the United States and the United Kingdom. He also founded Pricing University and is the author of the Pricing Periodic Table, CXO Edition.
To discuss how the margin levers apply to your business, contact Ron Wood at info@pricinginsight.com.au or on +61 410 534 099, or visit Pricing Insight.
Staples, Fletcher Insulation, King Living and the foodservice packaging supplier’s A$2 million EBIT figures are realised results as published in Pricing Insight case studies; the Staples discounting figures, the caterer account figures and the foodservice gross margin example are as reported in the Pricing Periodic Table, CXO Edition, where the caterer opportunity is projected. Stramit and the foodservice packaging supplier’s A$6 million to A$9 million figures are identified opportunities, not results. The Stramit and Fletcher Insulation staff comments come from Pricing Insight diagnostic work; staff are quoted by role only. Gross margin figures for Dulux Group, Boral, Brickworks and Fletcher Building are from public reporting, and the comments on Hilti and Caterpillar are commentary on public information. Results are as reported by Pricing Insight and have not been independently audited. No figure in this paper is typical or guaranteed.