

White paper · Diagnose · 20 min read
Sources: Staples, Arnott’s and foodservice packaging supplier case studies published on pricinginsight.com, with the Staples and Arnott’s results also reported in the Pricing Periodic Table, CXO Edition. All three are realised results as reported by Pricing Insight, not independently audited, and none is a benchmark for another business.
Company boards and private equity owners need to understand their pricing risks. Pricing is often either buried under management structures or listed as a marketing responsibility, as it tends to be incorrectly known as one of the 4Ps of marketing.
The question this paper answers
What pricing risks sit inside a portfolio company, and what should a board or private equity owner ask management to do about them?
Key takeaways
- Pricing is often treated as a marketing responsibility or an afterthought, despite being described as the most powerful profit lever.
- Common pricing risks include cost-plus pricing, excessive discounts, blanket pricing, weak use of data and cross-functional misalignment.
- Active pricing initiatives can improve margins and earnings, while failing to implement a pricing function can forgo potential gains and lead to further margin erosion.
- Boards can use structured questions to assess customer value, pricing strategy, trade agreements, management alignment, skills, sales, analytics and systems.
Five Pricing Insight clients show what those risks cost and how quickly they can be reversed. Toll Group, Staples, a foodservice packaging supplier backed by Five V Capital, Arnott’s and Fletcher Insulation each appear below in the same six-part form: the problem and what it put at risk, why it was hard to fix, what Pricing Insight did, the outcome with its status, the benefit to the client, and the Pricing Periodic Table elements the work built.
01Investors should treat pricing as a strategic priority, because most businesses still treat it as an afterthought
The reality is that pricing is your most powerful profit lever, and it is our experience that pricing today is still treated as an afterthought. We recently came across a freight company (with nearly $1b in revenue) that simply put blanket price rises into the market without any consideration for the commercial impact, and without having undertaken any analysis of customers, segments and products/services. This is high risk pricing behaviour and symptomatic of a cost-plus culture. The company is not making any money and has lost their way strategically.
What we find, across more than 160 client engagements since 2007, is that pricing is not well-managed. We have evaluated the pricing capability of dozens of companies and here is a list of the often-hidden problems or pricing risks we find:
- Culture of “cost plus mark-up” pricing.
- Sales teams offering excessive discounts to win or retain business.
- Managing price across a large product and customer range leading to simplistic blanket pricing behaviours that leave margin on the table.
- Large amounts of data and an inability to use that data for more strategic decision-making.
- Cross-functional management misalignment.
- No clear understanding of value drivers for key accounts to support price position in the market.
- Inability to obtain price increases.
Seven risks, each with a cost a board can size. Exhibit 1 sets each risk beside what it puts at risk, the board question in section 04 that tests for it, and the client case in this paper where Pricing Insight dealt with it.
| Pricing risk | What it puts at risk | Board question that tests for it | Client case |
|---|---|---|---|
| 1. Cost plus mark-up culture | Major contracts priced below the value customers receive | Value management; Pricing strategy | Toll Group |
| 2. Excessive discounts | EBIT margin given away deal by deal | Sales and negotiation | Staples |
| 3. Blanket pricing across a large range | Margin left on lines and customers that would pay more | Pricing structures | Toll Group; foodservice packaging supplier |
| 4. Data not used for decisions | Margin leaving through decisions nobody approved as a set | Analytics and methods; Systems and toolsets | Foodservice packaging supplier |
| 5. Cross-functional misalignment | Promotional and channel spend with no view of its return | Management alignment | Arnott’s |
| 6. Value drivers of key accounts unknown | Tenders won on price that could have been won on value | Value management | Toll Group |
| 7. Price increases not obtained | Cost inflation absorbed in gross margin | Skills and capability; Pricing structures | Fletcher Insulation |
Exhibit 1. The seven pricing risks from Pricing Insight’s capability evaluations, set against the board questions in section 04 and the client cases in this paper.
Freight is the clearest case of the first risk. A freight business sells what looks like one service, from point A to point B, yet the value of that service varies widely by freight type, lane and customer, and a cost-plus mark-up or a flat increase cannot see the difference.
Toll Group
Transport and logistics · A$8.4m EBIT uplift modelled in year 1 · Modelled
| Client and problem | Toll sold freight services to more than 13,000 customers across the three business units Pricing Insight evaluated, on a gross margin of about 45 per cent and an EBIT margin of about 3 per cent. Prices were built on cost-plus and moved by flat increases, and a number of major contracts were priced below the value customers received from Toll. |
| Challenge | Sales set almost all prices, rate cards and price differentials across freight types, customers and regions were inconsistent, and pricing analysis and competitor intelligence were limited. In one tender Toll priced 15 per cent below the incumbent carrier, while the customer, a salmon producer, later said it would have paid 5 to 10 per cent more than the incumbent’s price to change supplier. |
| What Pricing Insight did | A pricing diagnostic of strategy, structures and operations, strategy workshops across the three business units, analysis of all pricing by customer, freight type and region, a review of rate bands, and a Project Blackbird algorithm that set price by customer value in place of flat across-the-board increases. |
| Outcome | A$8.4m EBIT uplift modelled in year 1, as published. Modelled, not realised. |
| Benefit to the client | On a 3 per cent EBIT margin each point of price moves earnings sharply, and freight priced lane by lane and customer by customer reduces the exposure of major contracts to cost-plus prices that leave money with the customer. |
| Periodic Table elements built | 50 Md Price-setting method; 03 Vq Value quantification; 46 Pm Price modelling; 08 Sg Segment and channel strategy. |
02Pricing failures do more damage than most business failures, and budget pressure is where they start
These issues will be present in your portfolio, or in the businesses you may be undertaking due diligence on. Should we leave these issues for the CEO and management team to decipher and figure out? We want to be a supportive board; we don’t want to appear overly controlling.
How best to ensure that we are not risking margin loss and potential future pricing disasters?
Failure to understand pricing and pricing risks is more catastrophic than any other business element. Executives under pressure to meet a budget may start to drive excessive discounts, pursuing revenue at the expense of margin and EBITDA.
One of the most celebrated cases of this behaviour was Southcorp Limited, which drove their business into the ground through excessive trade promotions. Southcorp filled up the supply chain with discounted inventory that then did not translate into incremental consumption at retail. Recently, Bellamy’s milk products also undertook a desperate discounting tactic to try to repair revenues after changing their go-to-market and business model strategy. The discounting tactic backfired and earnings collapsed.
Both accounts are commentary on public reporting, not Pricing Insight client work. The mechanism is the same one Pricing Insight sees inside private businesses at smaller scale: revenue grows while profit falls, and the discounts that produced the revenue sit inside individual deals where the headline numbers do not show them.
When a business is cost-plus and there is no strategic pricing capability set up in the business (e.g. pricing management function and C-level support), we have found there is material margin improvement potential available.
Staples
Office supplies distributor · A$6.8m EBITDA within 12 months · Realised
| Client and problem | Staples grew revenue by 5 per cent while profit fell 3 per cent. Its reps were discounting 5 to 15 per cent on a 6 per cent EBIT margin, so seller discretion alone could take the whole EBIT margin on a sale. |
| Challenge | The discounting sat inside individual deals across thousands of items, and growing revenue hid it in the headline numbers, which is the pattern a board sees too late when it reviews revenue and EBITDA in total. |
| What Pricing Insight did | An SKU-level diagnostic and quick wins, then algorithmic price optimisation through Project Blackbird on 5,000 items, setting prices by customer and product from the business’s own transactions. |
| Outcome | A$6.8m of EBITDA within 12 months on A$80m of addressable revenue, a realised result as published. |
| Benefit to the client | Earnings growth from revenue the business already had, with set prices in place of discretionary discounts on a thin EBIT margin, which removes the exposure to the next budget-driven round of discounting. |
| Periodic Table elements built | 12 Mi Margin improvement program; 61 Da Discount authority and controls; 46 Pm Price modelling; 49 Lp List price alignment. |
03Pricing gains compound over several years, and so does the cost of leaving pricing unmanaged
Pricing improvements are cumulative and, like a minimum viable product, they get better in the second, third and fourth iterations. In fact, you should be rewriting your pricing strategy at least two to three times in 24 months as you test and learn what revenue models and price levels are commercially sustainable.
The gains from active pricing initiatives build over three to five years. The inverse of this situation is also true: Failure to implement a progressive pricing function will mean these potential gains are forgone and further margin erosion may be experienced, making the delta even larger.
More importantly, boards, CEOs, and senior executives can now undertake informed and mature discussions around pricing strategy without the perception that it is a black art or, in the words of Warren Buffett, a prayer session that is required to implement a price increase.
Imagine a situation where your portfolio of companies has a common operating platform to manage pricing. You can implement successful price increases much more easily, driving further earnings growth. Sales, marketing and finance work collaboratively together to the agreed plan and there is no cult of personality or dominant behaviours that send the business into a tailspin because of one individual’s cognitive biases. You will be able to cross-pollinate ideas and staff across business units, and company portfolios, to extract even further margin enhancements.
Upon exit, you can show prospective buyers your well-defined pricing strategy and methodology that de-risk earnings projections and ultimately allow you to sell the business for a higher EBITDA multiple.
There are several benefits that accrue to active investors who get pricing strategy right. The first is earnings growth. Price optimisation programs return between 5 and 10 times their cost in year 1. This is a conservative estimate for companies where pricing has taken a back seat and is not on the CEO’s weekly radar, or has been managed on a cost plus mark-up basis.
Two clients show the first gains arriving early in an owner’s plan. A private equity backed packaging supplier took realised EBIT from quick wins before the larger structural work, and Arnott’s recovered its result within a year once one team owned pricing and promotional spend.
Foodservice packaging supplier, backed by Five V Capital
Foodservice packaging · A$2m EBIT from quick wins · Realised
| Client and problem | The published case study records a price structure shaped by many individual decisions with no overall design: net price was not visible at the point of sale, discounts followed no rule, and the published price list governed only part of revenue, so margin left through decisions nobody had approved as a set. |
| Challenge | Tens of thousands of negotiated prices sat in the system, each a separate decision, and the owner needed earnings it could see in the results early, not a long program with the gain at the end. |
| What Pricing Insight did | A pricing diagnostic and quick wins first, then a national price list architecture and a customised discount matrix that replaced tens of thousands of negotiated prices with a few hundred rules, supported by a mandated pricing team, key account management tools, AI value selling and Pricing University. |
| Outcome | A$2m of EBIT realised from pricing quick wins, with a further A$6m to A$9m of margin opportunities identified, as published. The A$2m is realised; the A$6m to A$9m is identified, not realised. |
| Benefit to the client | Realised EBIT in the results early in the hold, a sized further opportunity the owner can carry into the value-creation plan, and a rule-based price structure that lowers the risk of margin leaving through unapproved decisions. |
| Periodic Table elements built | 12 Mi Margin improvement program; 26 Pf Pricing function mandate; 51 Dt Discount structure and tiers; 49 Lp List price alignment. |
Arnott’s
Biscuit maker · Over A$5m EBIT recovered in 12 months · Realised
| Client and problem | Arnott’s 41 account managers were making promotional promises to retailers that nobody tracked, so promotional funding and channel terms moved margin without anyone seeing what each promotion returned. |
| Challenge | Each account manager held the account’s commitments individually, and channel conflict meant a price set for one channel affected another, so there was no single view of which promotions paid and no one function that owned the answer. |
| What Pricing Insight did | Pricing was centralised in a pricing team, promotional return was modelled for 100 SKUs, channel conflict was resolved and execution was reshaped across the 41 account managers. |
| Outcome | Over A$5m of EBIT recovered in 12 months on a A$100m base, a realised result as published. |
| Benefit to the client | EBIT equal to about 5 per cent of the revenue base came back within a year, and promotional funding now runs through one team that can see its return, which lowers the exposure to promotions that cost more than they earn. |
| Periodic Table elements built | 26 Pf Pricing function mandate; 21 Ca Cross-functional alignment; 46 Pm Price modelling; 08 Sg Segment and channel strategy. |
04Six questions let a board test the value, strategy and people behind price
The checklist below is designed to help investors and boards evaluate pricing strategically and operationally. The questions that can be asked by the board are designed to coach and empower the CEO to make high pay-off investments while reducing business risk.
Value management
Do we have clear documentation of customer value drivers, and a communication and capture plan for our products and services?
Pricing strategy
Is there a published pricing strategy that aligns brand positioning, customers served and tactics in the market?
Trade agreements
Are the company’s contract structures designed to maximise share of wallet and protect existing cash flows with the correct rebate structures?
Management alignment
Are the executives aligned with the line managers across sales, marketing, finance and operations on pricing strategy and tactics?
Skills and capability
Have we resourced our business with trained staff to manage pricing strategy, platforms and systems and daily operating decisions?
Sales and negotiation
Do we employ value-based selling and negotiation strategies to generate more profitable revenue growth?
05Three further questions test the structures that carry price into every invoice
Analytics and methods
Do we have a suite of analytics and methods that we use to provide leading and lagging indicators (both internal and external) of pricing power beyond standard margin reports?
Systems and toolsets
Do we have the right pricing toolsets and systems that allow fast and accurate pricing decisions to be made?
Pricing structures
Does our pricing architecture allow our business to maximise revenue and margin across all product/service and customer segments?
Ideally, this checklist of questions can be customised to your business model and refined through more detailed exploration with management in a workshop environment. Workshops provide a non-threatening, open forum that enables investors to evaluate the pricing culture, teamwork and capability that reveals so much more than the flat dynamic of a sit-down meeting.
An insulation manufacturer shows how far a business can be behind on these questions without the board seeing it. It had no base list price, most pricing decisions sat with one analyst, and sellers had no tactics guide, yet the people quoting understood the pricing maths as well as their peers in other business units. The gap was structure and resources, which a board can fund, not knowledge.
Fletcher Insulation
Insulation manufacturing · 250 basis points of gross margin, about A$2.25m annualised EBITDA · Realised
| Client and problem | Fletcher Insulation sold through territory managers across all six states and territories, with most customers individually priced and many quotes built job by job in spreadsheets. Insulation is a small share of a builder’s total cost, customers compare square-metre rates, and imported product had widened their choice, so holding and raising price was hard. |
| Challenge | There was no base list price, most pricing decisions rested with one central analyst, sellers had no pricing tactics guide, and approvals could pass through three or four people. A staff member said: “We don’t have a retail price list, which is really Sales 1.01.” |
| What Pricing Insight did | A pricing capability diagnostic across the parent group’s six business units located the gaps in price architecture, discount control and pricing resources, and sized an EBIT opportunity of A$2.2m to A$2.5m. Staff then completed Pricing University’s Pricing Fundamentals, and the business acted on what they learned. |
| Outcome | A new pricing structure, a price increase and reduced discounting lifted incremental gross margin by 250 basis points, an annualised run-rate of about A$2.25m to EBITDA, a realised result as recorded from the engagement. The diagnostic figure is an identified opportunity. |
| Benefit to the client | A price increase obtained in a market where customers compare square-metre rates, with a list price structure and discount control that make the next increase easier to hold. |
| Periodic Table elements built | 49 Lp List price alignment; 43 Pi Price increase process; 61 Da Discount authority and controls; 28 Cc Commercial capability and training. |
06Owners can identify pricing risk during due diligence and act on it in the first 100 days
During due diligence
- Does the company have pricing power from its business model and industry dynamics?
- Is pricing expertise spread across the business, or is it in the hands of the founder or a select group only?
- What are annual EBITDA pay-offs if we can obtain 100, 200 or 300 basis points of margin? Does this change our priorities?
- Which project ranks higher than pricing in terms of annualised EBITDA pay-off?
During the first 100 days
- What methods and controls are in place to mitigate margin risk?
- How soon can we implement a dedicated pricing function?
- Where are the quick-win margin gains?
- Do we need to look at culture and teamwork initiatives to manage pricing better?
- What methods, tool-sets and platforms do we have or want in order to make pricing a strategic asset?
Answering the third due diligence question takes one line of arithmetic. Each 100 basis points of margin on revenue is that share of revenue added to EBITDA, before any change in volume, so the pay-off scales with the size of the business.
| Annual revenue | +100 bps | +200 bps | +300 bps |
|---|---|---|---|
| A$100m | A$1.0m EBITDA | A$2.0m EBITDA | A$3.0m EBITDA |
| A$250m | A$2.5m EBITDA | A$5.0m EBITDA | A$7.5m EBITDA |
| A$500m | A$5.0m EBITDA | A$10.0m EBITDA | A$15.0m EBITDA |
Exhibit 2. Annual EBITDA from 100, 200 and 300 basis points of margin at three revenue levels, volume held constant. Illustrative arithmetic, not a forecast for any business. Fletcher Insulation’s 250 basis points sits inside this range.
Read against the client cases, the table gives the fourth question a scale and a timing: the gains in this paper came within 12 months at Staples and Arnott’s, and from quick wins at the packaging supplier.
07The Pricing Periodic Table elements this paper builds
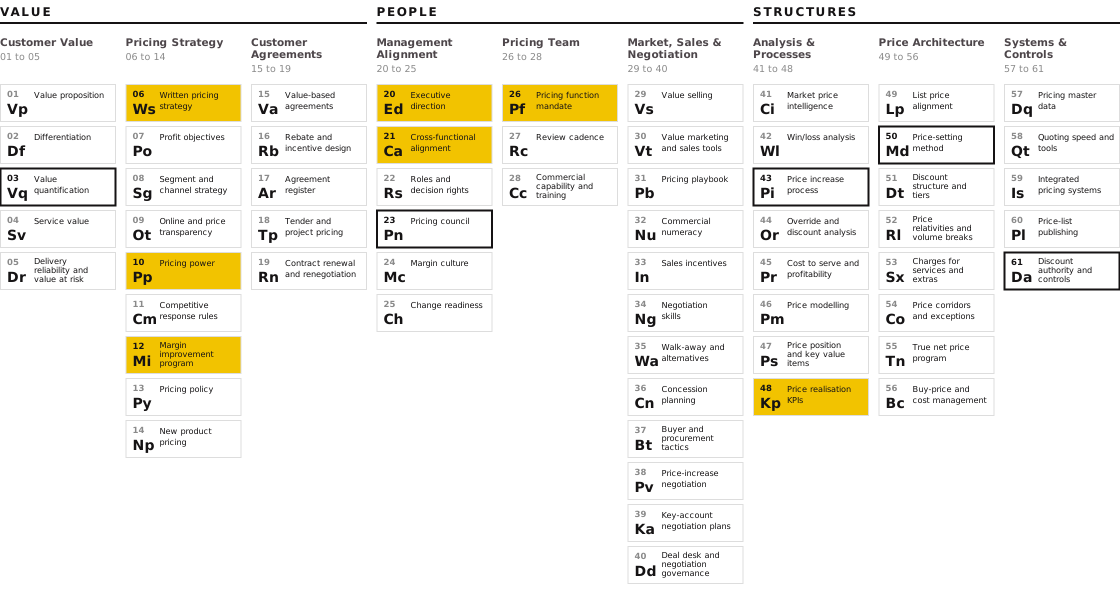
Sixty-one elements of pricing capability, in nine domains across Value, People and Structures, make up the Pricing Periodic Table. Seven are built by the board review in this paper: 20 Ed Executive direction (pricing on the board agenda), 06 Ws Written pricing strategy (the published strategy the board asks for), 21 Ca Cross-functional alignment (sales, marketing, finance and operations working to one plan), 26 Pf Pricing function mandate (a dedicated pricing function), 12 Mi Margin improvement program (the pricing initiatives and quick wins), 10 Pp Pricing power (the first due diligence question) and 48 Kp Price realisation KPIs (leading and lagging indicators beyond standard margin reports). Five are depended on: 03 Vq Value quantification supplies the value drivers of key accounts, 50 Md Price-setting method decides whether cost-plus survives, 61 Da Discount authority and controls holds the line under budget pressure, 43 Pi Price increase process decides whether an increase is obtained, and 23 Pn Pricing council gives the board one body to ask.
Each client case maps onto these elements. Toll Group replaced cost-plus through 50 Md and 03 Vq, Staples and the packaging supplier built 12 Mi with set prices and discount rules, Arnott’s built 26 Pf and 21 Ca by putting pricing and promotional return in one team, and Fletcher Insulation obtained a price increase once 49 Lp and 43 Pi were in place. In each case the risk on the board’s list was removed by building the element that was missing.
08Frequently asked questions
How can private equity owners use pricing to lift EBITDA during the hold period?
Test pricing power and the spread of pricing expertise during due diligence, size what 100 to 300 basis points of margin is worth, then take quick wins in the first 100 days while a pricing function and price structure are built. A foodservice packaging supplier backed by Five V Capital realised A$2m of EBIT from quick wins, with a further A$6m to A$9m identified. Price optimisation programs return between 5 and 10 times their cost in year 1.
My margins are shrinking. What should I do about pricing?
Find where margin is leaving before changing prices: discounts by rep and customer, blanket increases that were overridden, and contracts priced on cost-plus. Then replace discretion with set prices by customer and product. Staples grew revenue 5 per cent while profit fell 3 per cent; set prices across 5,000 items returned A$6.8m of EBITDA within 12 months, a realised result.
How do I set up pricing governance and discount approval rules?
Give one function the mandate for price, write the pricing strategy down, set discount authority by role and margin, and have a pricing council review results each month. Arnott’s centralised pricing in one team, modelled promotional return for 100 SKUs and recovered over A$5m of EBIT in 12 months, a realised result.
When should a CEO or board bring in a pricing consultant?
When pricing is cost-plus with no pricing function, when revenue grows and profit does not, when price increases are announced and then overridden, or when an owner needs earnings in the hold period. A diagnostic sizes the opportunity against named causes first. Fletcher Insulation’s diagnostic sized A$2.2m to A$2.5m of EBIT; the business then lifted gross margin by 250 basis points, realised.
What return can a business expect from a pricing program?
Price optimisation programs return between 5 and 10 times their cost in year 1, and the return is highest where pricing has been cost-plus and off the CEO’s radar. Results vary with the business: Staples realised A$6.8m of EBITDA within 12 months on A$80m of addressable revenue, and Toll Group’s uplift was modelled at A$8.4m in year 1. No result is a benchmark for another business.
09How Pricing Insight helps
Pricing Capability & Governance can help boards address the organisational risks behind weak pricing: unclear ownership, inconsistent discounting and misalignment across teams. It sets pricing roles, decision rights, discount approvals, price floors and a Pricing Council, giving management a clearer framework for making and sustaining pricing decisions.
Pricing Insight’s work runs in three stages, each drawing on evidence from the client’s own transactions. Pricing Insight has completed 160+ engagements, and price optimisation programs return between 5 and 10 times their cost in year 1.
Diagnose
Answers to the board’s nine questions, taken from the business’s own invoices and people through the Strategic EBIT Opportunity & Risk Diagnostic: the seven pricing risks located, the quick wins named, and the margin opportunity sized against a baseline finance accepts, for due diligence or the first 100 days.
Optimise
Cost-plus and blanket increases replaced with prices set by customer and product through the EBITDA Improvement Program, with discount rules, price floors and ERP-ready files, so the first gains reach the results early in the owner’s plan.
Transform
A pricing function with a mandate, decision rights and a Pricing Council through Pricing Capability & Governance, staff trained through Pricing University, and price realisation KPIs in the board pack, so the gains hold through to exit.
Which of the seven pricing risks is in your portfolio, and what is it costing?
A first conversation establishes how this applies in your business and whether a diagnostic is warranted. Ron Wood, +61 410 534 099.
Ron Wood is the Founder and Managing Director of Pricing Insight, an Australian pricing strategy consultancy he established in 2007. He has worked in pricing for 30 years, first as a pricing and commercial manager in consumer goods, building materials and capital equipment, and since then across 160+ engagements in Australia, New Zealand, South East Asia, India, the United States and the United Kingdom. He also founded Pricing University and is the author of the Pricing Periodic Table, CXO Edition.
To discuss the pricing risks in your business or portfolio, contact Ron Wood at info@pricinginsight.com.au or on +61 410 534 099, or visit Pricing Insight.
Staples, Arnott’s, foodservice packaging supplier and Fletcher Insulation figures are realised results as published in Pricing Insight case studies or recorded from the engagement; the foodservice packaging supplier’s A$6m to A$9m and Fletcher Insulation’s A$2.2m to A$2.5m are identified opportunities, not results. The Toll Group figure is a modelled result, not a realised one. The Southcorp and Bellamy’s accounts are commentary on public reporting. The Fletcher Insulation staff comment comes from Pricing Insight diagnostic work; staff are quoted by role only. The basis point table is illustrative arithmetic. Results are as reported by Pricing Insight and have not been independently audited. No figure in this paper is typical or guaranteed.