

White paper · Optimise · 17 min read
Sources: King Living, Bunzl and Flannerys case studies published on pricinginsight.com. All three are realised results as reported by Pricing Insight, not independently audited, and none is a benchmark for another business. The Coca-Cola prices in this paper are retail prices quoted by the author, not Coca-Cola company data.
Coca-Cola pricing can demonstrate how there are multiple price points depending on the customer “need state”. Here’s a B2C (Business to Consumer) example, but one which has relevance in the B2B markets as well. It is all about need states, as shown through the example of the humble can of Coca-Cola.
The question this paper answers
How many prices can one product carry, and how does a B2B business set a price for each customer need, use and location without losing the customers who buy on price?
Key takeaways
- Pricing power can come from usage, location and the utility customers derive, rather than changes to the product itself.
- A product can have different price points depending on whether it is bought in bulk, chilled or immediately available.
- Customer need states, benefits, final usage, consumer profile, occasion and location can inform segmentation.
- Segmenting customer need states can help identify revenue and margin opportunities.
01One can of Coca-Cola sells at seven price points, from 50 cents to $5.00
What is your source of pricing power? How many price points can you have for the one particular product?
These questions are often asked, and they often have a simple answer: that there is only one price point that you can charge.
How one product carries multiple price points
Coca-Cola’s price is not fixed. You can purchase it for 50 cents a can, but it can also be purchased for $4.95 or $5.00 a can, and at price points in between, from $1.49, to $1.99, $2.50, $3.75, $4.50 and then $4.95. That’s up to a 1000%, or 10x, differential. Ten times from 50 cents to $5.00.
How are those price points possible? Well, let’s just take a look at some of the principles. Can you guess where these price points are found? For a 50 cent can of Coke, you are buying the product as a slab of 24 cans. So you can see there is a saving there, because it’s a quantity buy. For a $1.49, you are getting it from the supermarket as an individual can, which is chilled and ready to drink.
From a convenience store or petrol station you are going to pay a little bit more of a premium because it’s more of an impulse buy and you need it now, and there’s nowhere else to get it. So it’s $1.99.
Coca-Cola pricing in a vending machine is different again. Quite often these machines are in a place where there is no other source of food or drink available, at a train station late at night, for example, and so the price point is $2.50. If you were to sit down at a café you’ll be paying $3.75.
If you were to have that same can of Coke at a restaurant you’d be paying $4.50.
And finally, if you find yourself in a hotel room and looking at the mini bar fridge, you’ll see on the menu that same can of Coke for $5.00, or maybe more.
| Where the can is bought | Price a can | Multiple of the slab price | What the buyer is paying for |
|---|---|---|---|
| Slab of 24 cans | $0.50 | 1.0x | A quantity buy, unchilled, many cans at once |
| Supermarket, single can | $1.49 | 3.0x | One can, chilled and ready to drink |
| Convenience store or petrol station | $1.99 | 4.0x | An impulse buy, needed now, with nowhere else to get it |
| Vending machine | $2.50 | 5.0x | No other source of food or drink nearby |
| Café | $3.75 | 7.5x | A seat and service |
| Restaurant | $4.50 | 9.0x | The same can, served at the table |
| Hotel minibar | $5.00 | 10.0x | Chilled, ready now, without leaving the room at an odd hour |
Exhibit 1. Seven prices for the same can. Prices are those quoted by the author in the published paper, observed in Australian retail at the time of writing; they are public shelf prices, not Coca-Cola company data. Multiples are arithmetic on the 50 cent slab price.
02Pricing power sits in the use, the location and the need, not in the product
Now, this same can of Coke can be sold for even higher prices, but the key principle here, and the question we need to ask, is “Where is the source of pricing power?”
Is it in the product and the components itself? The components don’t change from the 50 cent scenario to the $5.00 scenario. It’s exactly the same product.
So why the difference in Coca-Cola pricing?
What changes is obviously the location and, more importantly, the type of consumption and the need state, or want state. In the case of the 50-cent can, the Coca-Cola is unchilled, not pleasant to drink right now, and you are going to have to take a lot of them. In the case of the minibar fridge, it’s chilled, it’s ready to drink right now, and you really don’t want to have to go out of your hotel room to source a can of Coke at an odd hour of the day or night. So the pricing power is to be found in the usage and the location, and the utility that the customer derives from that.
Business markets work the same way. A distributor’s range, a manufacturer’s product family or a software catalogue is often sold at one list price with discounts negotiated off it, while the customers buying it sit in very different situations: one needs the item today, another is restocking on a plan, a third buys from a market where incomes are a fraction of the home market’s. Two Pricing Insight clients show the mechanism in a single range and in a single online store.
King Living
Furniture design, manufacture and retail · $4.1m incremental EBITDA · Realised
| Client and problem | King Living sells modular, customisable furniture across configurations, materials, upgrades and services. The premium for moving between two related configurations varied considerably with the fabric or leather chosen, so the price steps across the range did not follow what the customer was buying. |
| Challenge | Category averages concealed inconsistent price movements between comparable products and uneven premiums for a finish or configuration, and the breadth of choice made one coherent structure hard to hold. |
| What Pricing Insight did | Analysis of sales and realised selling prices across 2020 to 2022 from category down to package and material grade, a price architecture review, and showroom visits and mystery shopping. The recommendations set clearer relationships between related products, deliberate entry, mid-range and premium price points, and a model that separates the transport charge from the set-up and packaging-removal service. |
| Outcome | King Living implemented the advice and generated $4.1 million in incremental EBITDA, a realised result as published. |
| Benefit to the client | Value captured from the relationships between products, upgrades and services rather than from a single percentage increase, with a service charge recovering the cost of delivery and set-up and less exposure to a premium that customers could not see the reason for. |
| Periodic Table elements built | 52 Rl Price relativities and volume breaks; 47 Ps Price position and key value items; 53 Sx Charges for services and extras; 49 Lp List price alignment. |
Orbx
Flight simulation software, owned by Bombora · Country pricing across 120 countries · Identified
| Client and problem | Orbx sells scenery and other content for flight-simulation software to customers worldwide through one online store. Its investor, Bombora, engaged Pricing Insight in 2019 to review international pricing and revenue opportunities across 120 countries. About 80 per cent of revenue came from the top ten countries and 90 per cent from the top twenty. |
| Challenge | An online store makes the same product available everywhere; it does not make it equally affordable in every country. The question was whether smaller markets lacked demand or needed a different price and market approach, which meant separating purchasing power, existing customer penetration and spending behaviour. |
| What Pricing Insight did | Two years of Orbx’s sales data analysed with country population and GDP per person, cross-checked against platform information and published user research, with the United Kingdom as the established-market benchmark adjusted for each country’s economics. The work set three responses: offers and bundles to lift annual spend in higher-purchasing-power markets, awareness and trial in affluent but under-penetrated markets, and more accessible pricing with lower-cost acquisition in lower-purchasing-power markets. |
| Outcome | Country-specific pricing and revenue opportunities identified, with market priorities and investment assumptions for Bombora, as published. Bombora used the work in its investment-committee paper. No financial result is published. |
| Benefit to the client | A basis for setting country prices and offers by purchasing power and observed behaviour in place of one global price, a blanket increase or a blanket discount, which lowers the risk of discounting in markets that would pay and overpricing in markets that cannot. |
| Periodic Table elements built | 08 Sg Segment and channel strategy; 41 Ci Market price intelligence; 10 Pp Pricing power; 09 Ot Online and price transparency. |
03Five need-state questions turn one list price into several price points
Now what can we learn from this? Well, think about the:
- need state of your customers
- utility or benefits derived
- final usage consumer profile
- final usage occasion
- location or geography
Can you segment out those need states into 7 or 8 different price points and purposes for buying?
And if so, can you identify what kind of revenue and margin opportunities are available to you? That’s pricing strategy in a can, from a humble can of Coke.
These examples exist in many different places. See if you can apply them in your business.
| Need-state question | B2B example | What sets the price |
|---|---|---|
| Need state of your customers | An urgent same-day order against a planned replenishment order | What a delay costs the customer |
| Utility or benefits derived | A product that cuts installation time against one that only meets the specification | Labour and time the customer saves |
| Final usage consumer profile | A trade professional using the product daily against an occasional buyer | Purchase frequency and the cost of switching |
| Final usage occasion | A project with a fixed completion date against routine maintenance | The penalty or downtime the customer avoids |
| Location or geography | A remote site with one supplier in reach against a metropolitan site with several | Freight, the alternatives within reach and local purchasing power |
Exhibit 2. The paper’s five need-state questions applied to a B2B range. Illustrative. Each row is a separate price point only if the business can tell the two buying situations apart in its own transaction data and hold the difference at the point of sale.
Three further clients show the second half of the question: once the situations are separated, a price is set for each and held. Flannerys set different rules for familiar and specialist products, Bunzl set price ladders by SKU and customer segment across a large range, and Stuart Alexander mapped its prices by product and by channel before choosing where to take margin.
Flannerys
Organic and natural food retail · Over A$1.0m incremental gross margin · Realised
| Client and problem | Flannerys sells certified organic produce and specialist dietary products with in-store advice from naturopaths and nutritionists, and had to respond to cost pressure and competition while staying competitive on the familiar products customers use to judge store value. |
| Challenge | A single pricing rule could not serve familiar products, specialist products bought occasionally and products often bought on promotion. Competitors’ advertised prices gave a different picture from what Flannerys received after its own discounts and promotions, so changing shelf prices alone would have missed part of the problem. |
| What Pricing Insight did | Project Blackbird: two years of product-level sales history analysed with customer spending and category performance by store, competitor benchmarking of comparable products and baskets across specialist organic retailers and supermarkets, and staged optimisation of prices across product groups, brands and pack sizes, with a trial on selected products and stores. The output was a product-level price file the business could review and upload in its existing systems. |
| Outcome | Over A$1.0m in incremental gross margin, a realised result as published. |
| Benefit to the client | Margin taken where prices could carry it and held back on the products that set customers’ view of store value, which lowers the risk of a blanket increase that sends price-sensitive shoppers elsewhere. |
| Periodic Table elements built | 46 Pm Price modelling; 47 Ps Price position and key value items; 41 Ci Market price intelligence; 08 Sg Segment and channel strategy. |
Bunzl
Global distributor · A$5.7m EBIT improvement · Realised
| Client and problem | Bunzl’s margins were shrinking as volume grew, and frequent overrides in tenders took prices below where the business needed them. |
| Challenge | The range ran to 18,000 SKUs across more than one division, and prices were set deal by deal through overrides rather than from a structure that recognised which customers and products could carry a higher price. |
| What Pricing Insight did | Project Blackbird price optimisation: price ladders by SKU and customer segment, discount guardrails that set how far a price could move, and a two-division pilot before wider rollout. |
| Outcome | A$5.7m EBIT improvement reported following price optimisation across 18,000 SKUs, realised. The CXO Edition reports, for the same work, 8 points of gross margin on targeted SKUs, overrides down 35 per cent and 98.3 per cent of customers kept, all realised. |
| Benefit to the client | Higher margin with almost all customers retained, so separate prices by segment did not cost the customer base, and a third fewer overrides left less margin exposed in tenders. |
| Periodic Table elements built | 08 Sg Segment and channel strategy; 52 Rl Price relativities and volume breaks; 54 Co Price corridors and exceptions; 46 Pm Price modelling. |
Stuart Alexander
Food, beverage and confectionery brands · Product and channel price positioning · No financial figure published
| Client and problem | Stuart Alexander & Co. imports, markets and distributes premium global food, beverage and confectionery brands in Australia, so each price is both a product decision and a channel decision. Management needed to know where its prices sat before choosing which strategies to pursue for margin. |
| Challenge | A portfolio-wide view of price hid differences between individual products and between channels, and knowing a product’s price is not the same as knowing its competitive position in each channel it is sold through. |
| What Pricing Insight did | Research and analysis of how a range of products was priced against competitors and within sales channels, linked to the pricing strategies with the greatest potential margin impact. |
| Outcome | Management gained a clearer view of product and channel price positioning and evidence to set margin-improvement priorities; no financial figure was published. Stuart Alexander’s CFO at the time of the engagement: “This research also enabled an understanding of price positioning within channels and was critical in identifying the strategies necessary to drive the greatest margin impact for the business.” |
| Benefit to the client | Margin work aimed at the products and channels where price position allows it, which lowers the risk of an increase on a line already priced above its competitors in that channel. |
| Periodic Table elements built | 41 Ci Market price intelligence; 47 Ps Price position and key value items; 08 Sg Segment and channel strategy. |
04The Pricing Periodic Table elements this paper builds
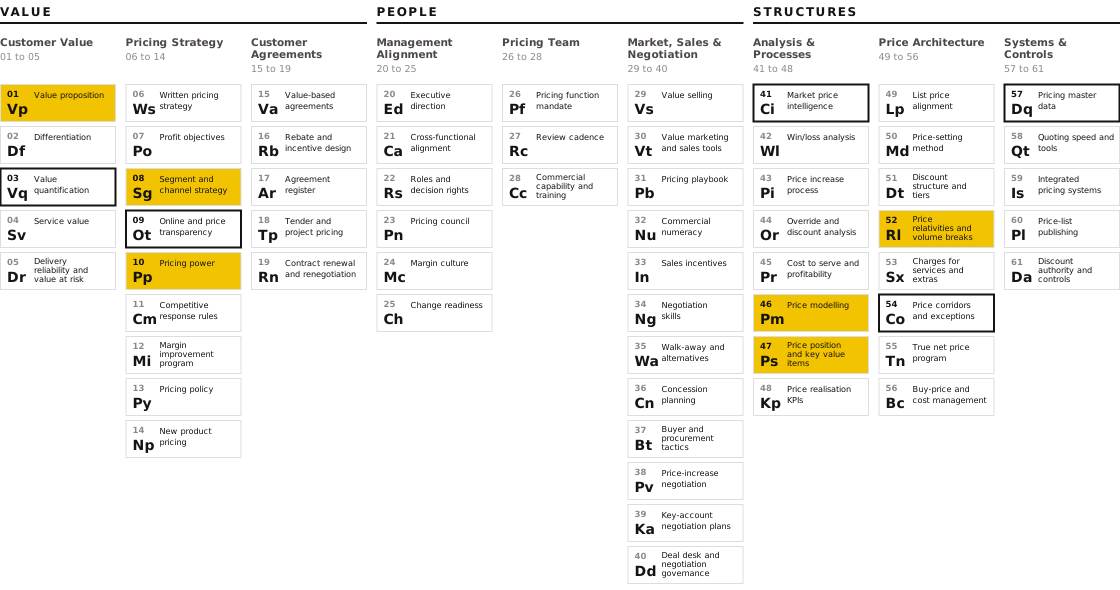
The Pricing Periodic Table sets out 61 elements of pricing capability in nine domains, across Value, People and Structures. Six are built by the method in this paper: 08 Sg Segment and channel strategy (grouping customers by need state, usage, occasion and location), 10 Pp Pricing power (finding where the customer’s situation, not the product, supports a higher price), 01 Vp Value proposition (the utility or benefit the buyer derives in each situation), 47 Ps Price position and key value items (which products set the customer’s view of price and which can carry more), 52 Rl Price relativities and volume breaks (the steps between the slab, the single can and the minibar), and 46 Pm Price modelling (setting a price for every product and customer group from transaction data). Five are depended on: 41 Ci Market price intelligence shows the alternatives each customer has within reach, 03 Vq Value quantification puts the need state in dollars, 54 Co Price corridors and exceptions stops one price point leaking into another, 09 Ot Online and price transparency decides how far prices can differ when customers can compare them, and 57 Dq Pricing master data holds the customer and product attributes the segments are drawn from.
The client cases map onto these elements directly. King Living built 52 Rl and 47 Ps by setting entry, mid-range and premium price points across one range. Orbx built 08 Sg and 10 Pp by country, with 09 Ot deciding how a single online store could carry different prices. Flannerys and Bunzl built 46 Pm, Flannerys by separating familiar from specialist products and Bunzl through price ladders held by 54 Co guardrails, and Stuart Alexander began with 41 Ci, the evidence of where each product stood in each channel.
05Frequently asked questions
What is pricing power and how do I measure it by customer?
Pricing power is the ability to hold or raise a price without losing the volume that matters. It sits in the customer’s situation as much as in the product: the same can of Coca-Cola carries ten times the price in a minibar that it carries in a slab. Measure it by grouping customers by need, usage and alternatives, then comparing realised price, margin and volume change across the groups. At Bunzl, price ladders by SKU and customer segment produced a A$5.7m EBIT improvement with 98.3 per cent of customers kept, a realised result.
Who offers price optimisation for Australian distributors with thousands of SKUs?
Pricing Insight runs Project Blackbird price optimisation, which uses a distributor’s own transactions to set a price for every SKU and customer group and delivers a price file ready to load into ERP and quoting systems. Bunzl’s work covered 18,000 SKUs and reported a A$5.7m EBIT improvement; Staples’ covered 5,000 items and reported A$6.8m of EBITDA within 12 months on A$80m of addressable revenue. Both are realised results as published.
How do I move from cost-plus pricing to value-based pricing in B2B?
Start with the customer’s situation, not the cost. Ask the five need-state questions in this paper for each product family, test which differences show up in your own sales data, and set a price for each group that the business can hold at the point of sale. King Living moved from uneven premiums to deliberate entry, mid-range and premium price points and generated $4.1 million in incremental EBITDA after implementing the advice, a realised result.
What ROI can an Australian distributor expect from a B2B pricing optimisation project?
Across Pricing Insight’s 160+ engagements, price optimisation programs return between 5 and 10 times their cost in year 1. The return in any one business depends on how far its prices sit from what each customer group will pay. Published results include Staples, A$6.8m of EBITDA within 12 months, and Bunzl, a A$5.7m EBIT improvement, both realised. Neither is a benchmark for another business.
My margins are shrinking. What should I do about pricing?
Find where the margin is going before changing any price. A single list price with negotiated discounts usually undercharges the customers in a hurry, at a remote site or without alternatives, and overcharges those who will leave. Separate the buying situations, then set and hold a price for each. Flannerys did this across product groups, brands and pack sizes and realised over A$1.0m in incremental gross margin.
06How Pricing Insight helps
To act on differences in customer need states and buying contexts, Project Blackbird: Price Optimisation uses your own sales data to build an optimised price file for every SKU and customer. The file is ready to load into ERP and quoting systems.
The work runs in three stages, each drawing on evidence from the client’s own transactions. Pricing Insight has completed 160+ engagements, and price optimisation programs return between 5 and 10 times their cost in year 1.
Diagnose
Twelve months of invoices by customer, product, channel and location through the Strategic EBIT Opportunity & Risk Diagnostic. Realised price by buying situation, the customers paying the same price in very different situations, and the gap between list and invoice, sized against a baseline finance accepts.
Optimise
Customer groups drawn from need state, usage, occasion and location, a price point for each, and price ladders between them, set through Project Blackbird and delivered as an ERP-ready price file for every SKU and customer.
Transform
Price corridors that keep one price point from leaking into another, sellers trained to sell on the customer’s situation through Negotiation Training & Value-Based Selling, and price realisation by segment reported monthly through Pricing Capability & Governance.
How many of your customers pay the same price in very different buying situations?
A first conversation establishes how this applies in your business and whether a diagnostic is warranted. Ron Wood, +61 410 534 099.
Ron Wood is the Founder and Managing Director of Pricing Insight, an Australian pricing strategy consultancy he established in 2007. He has worked in pricing for 30 years, first as a pricing and commercial manager in consumer goods, building materials and capital equipment, and since then across 160+ engagements in Australia, New Zealand, South East Asia, India, the United States and the United Kingdom. He also founded Pricing University and is the author of the Pricing Periodic Table, CXO Edition.
To discuss how this applies to your range, contact Ron Wood at info@pricinginsight.com.au or on +61 410 534 099, or visit Pricing Insight.
The Coca-Cola prices are retail prices quoted by the author at the time of writing; they are public shelf prices, not Coca-Cola company data, and the multiples are arithmetic. King Living, Bunzl and Flannerys figures are realised results as published in Pricing Insight case studies; the Bunzl gross margin, override and customer retention figures are as reported in the Pricing Periodic Table, CXO Edition. The Orbx revenue concentration and method are from the published Orbx case study; no financial result is published for Orbx or Stuart Alexander. The Stuart Alexander quote is attributed by job title. Exhibit 2 is illustrative. Results are as reported by Pricing Insight and have not been independently audited. No figure in this paper is typical or guaranteed.